How to Check CPU Performance on Any Device
Knowing how to check CPU performance is your first real step toward figuring out why your computer is slow, why it's getting hot, or just what kind of hardware you're actually working with. It's the key to getting a clear picture of your machine's health and what it's truly capable of.
Why Checking Your CPU Actually Matters
Ever been on a video call when your laptop's fans suddenly sound like they're preparing for takeoff? Or maybe your favorite game starts stuttering for no apparent reason? The culprit is often your Central Processing Unit (CPU), the brain of your entire system.
Learning to check on it isn't just a "techie" skill—it's incredibly practical for anyone who wants their computer to run smoothly and reliably.
Think of it like the dashboard in your car. You wouldn't just ignore the check engine light or the temperature gauge, and the same principle applies here. A quick look can tell you so much.
Understand Your System's Limits
Knowing your CPU's specs—its model, clock speed, and core count—tells you exactly what your device was designed to do. An older dual-core processor, for instance, is going to have a hard time with modern video editing software. A new eight-core beast, on the other hand, should chew through it without breaking a sweat.
This isn't just trivia. This information is vital when you're trying to decide if you can run that new piece of software or if it’s finally time to think about a hardware upgrade.
Pinpoint Performance Problems
When your computer grinds to a halt, the CPU is the first place you should look. I've seen it countless times: a single, rogue application can eat up 100% of your CPU's resources, bringing everything else to a standstill.
Checking the usage lets you spot the offender and take action. Sometimes it's as simple as closing a runaway browser tab, and other times it means uninstalling a poorly-coded program. Taking a proactive look can make a night-and-day difference in how responsive your machine feels. If your system still feels slow after checking the CPU, you might want to explore other ways to improve your computer's overall speed and responsiveness.
Monitor System Health and Temperature
Just like any hard-working engine, a CPU creates heat. A lot of it. If temperatures stay too high for too long, it can shorten the CPU's lifespan and trigger "thermal throttling"—a safety feature where the CPU intentionally slows itself down to prevent damage.
By keeping an eye on the temperature, you can get an early warning about cooling problems, like dust-clogged fans or dried-out thermal paste. This helps you keep your device running at its best for years to come.
Checking Your CPU on Windows Systems
If you're on a Windows machine, you're in luck. Some of the handiest tools for peeking under the hood at your CPU are already built right into the operating system. No downloads needed to get a quick, accurate snapshot of what your processor is up to.
The first place I always look is the Task Manager.
The quickest way to pull it up is with the classic keyboard shortcut: Ctrl + Shift + Esc. Once it's open, just click over to the "Performance" tab and select "CPU" from the side menu. This one screen gives you a fantastic real-time overview.
You'll see a live graph charting your CPU's workload, its current clock speed, and a running count of all the processes and threads currently active. Look just below the graph for the hard specs: the exact CPU model, its base speed, and, most importantly, the number of cores and logical processors (also known as threads).
Here's a look at the Task Manager's CPU performance tab in action.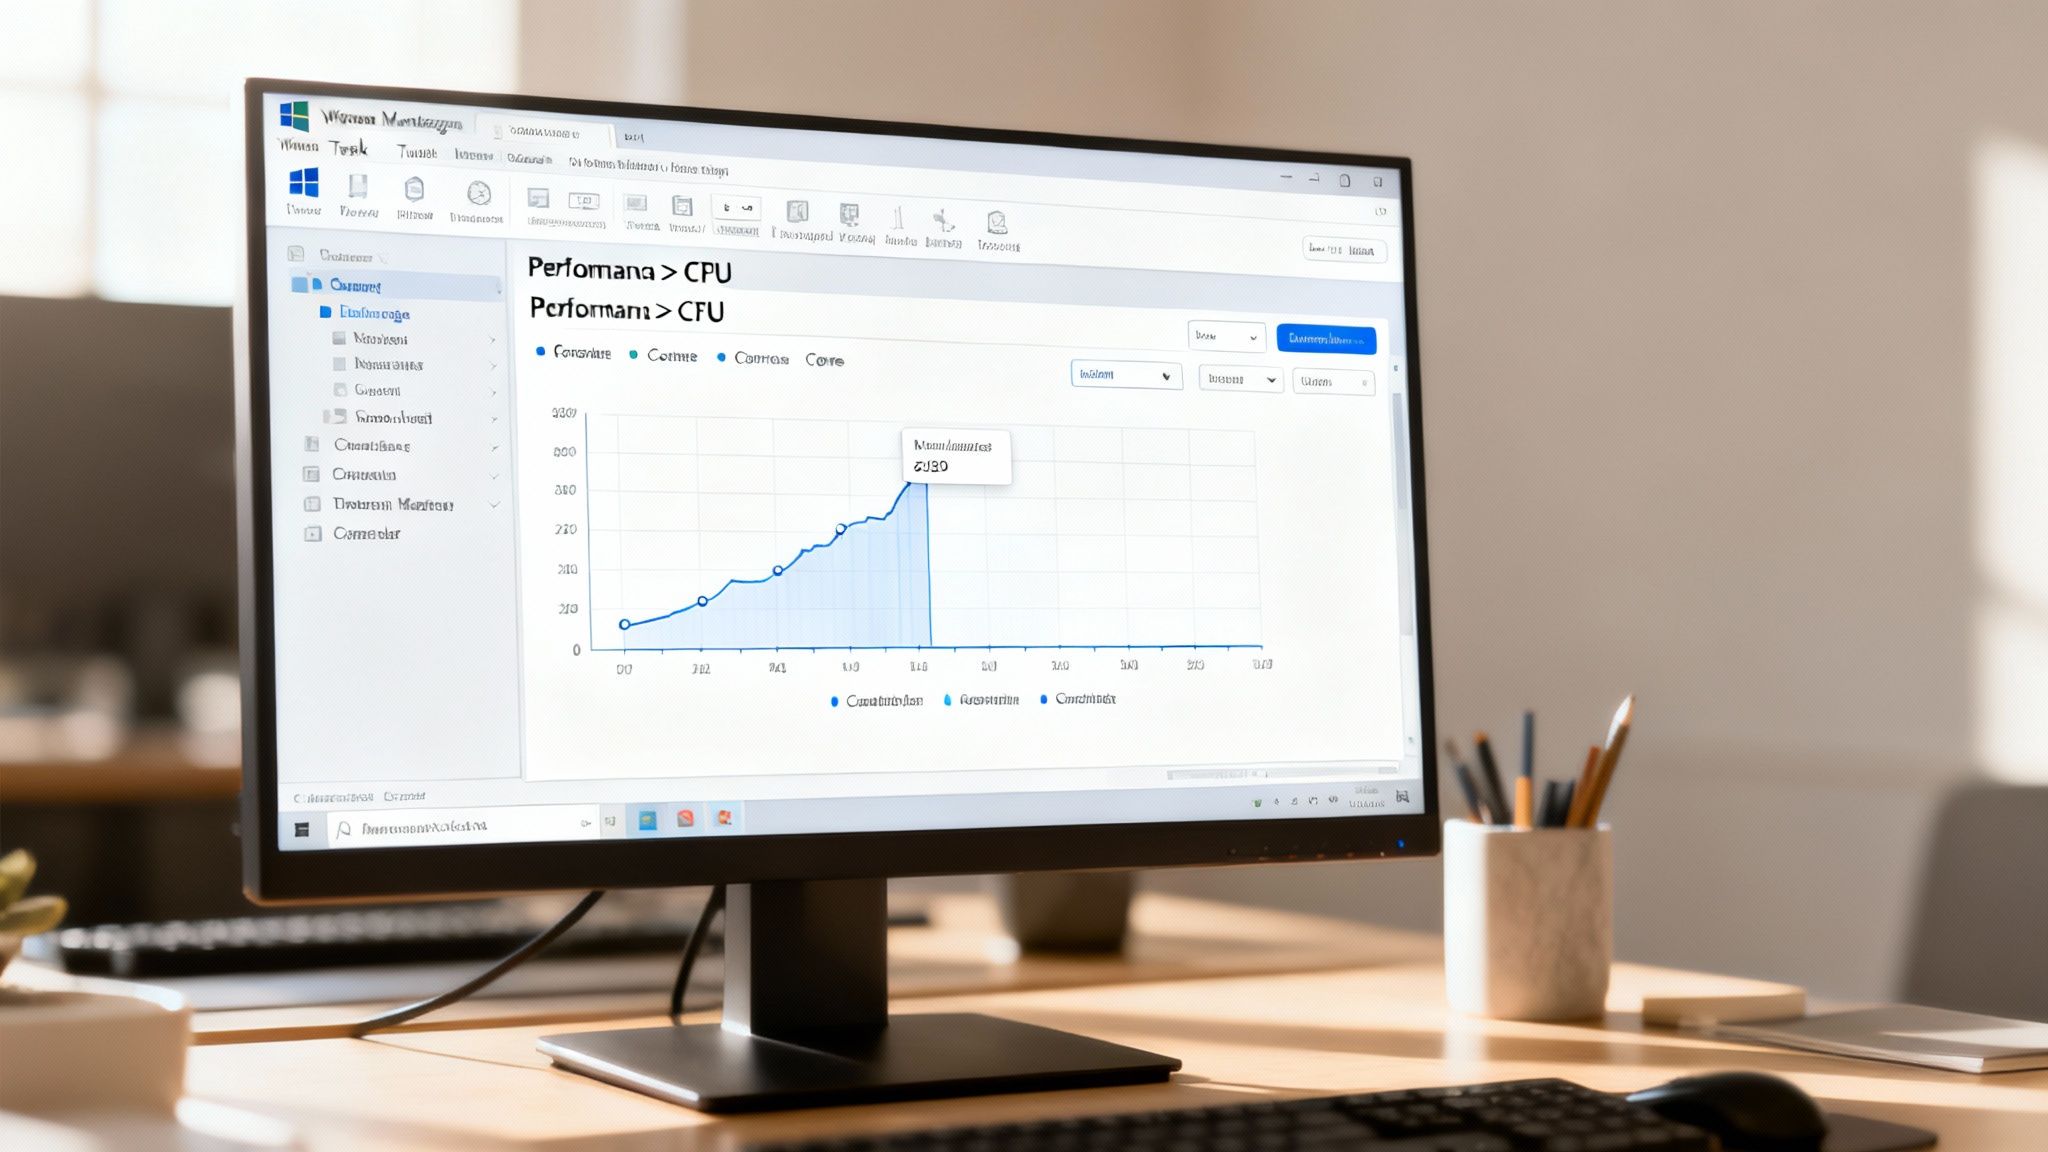
As you can see, the CPU model is listed right at the top, with the live utilization graph below it and all the juicy details like core count and cache sizes at the bottom.
For a More Detailed Report
Task Manager is perfect for watching your CPU's behavior live, but sometimes you just need a simple, static report of your system's hardware. This is where the System Information panel comes in.
To open it, just hit the Windows key, start typing "System Information," and press Enter when it pops up. The main page gives you a clean summary that includes your processor model and speed. It’s less about live action and more about getting the facts straight for things like checking software requirements or providing info to tech support.
Key Takeaway: For a quick look at live CPU usage and core count, use Task Manager (Ctrl + Shift + Esc). For a simple, non-changing report of your CPU model and other hardware, use the System Information panel.
Using Third-Party Tools for Deeper Insights
For most people, the built-in Windows tools are plenty. But if you're an enthusiast, a gamer, or trying to troubleshoot a specific problem, you'll probably want more granular data—especially when it comes to temperatures and voltages. That's where a few trusted third-party apps really shine.
Two of my long-time favorites are:
- CPU-Z: This tiny, lightweight program gives an incredibly detailed breakdown of your processor. It tells you everything from its internal codename and manufacturing process to its precise cache levels. It's pretty much the gold standard for confirming exactly what hardware you're running.
- Core Temp: Just like the name implies, this tool is all about one critical metric: heat. It shows you the real-time temperature of each individual CPU core, which is absolutely essential for diagnosing overheating problems when you're pushing your system hard with gaming or video rendering.
Honestly, checking the CPU's temperature is one of the main reasons people go looking for these tools in the first place. This demand has created a huge market—the global CPU temperature monitoring tools market was valued at around $1.2 billion and is expected to climb to $3.1 billion by 2033, growing at a solid 10.7% each year.
Keeping an eye on these numbers helps you spot trouble before it leads to performance throttling or, worse, hardware damage. If you do find that high CPU usage from mystery processes is bogging your system down, our guide on how to speed up computer performance has some practical steps you can take right now.
Finding CPU Information on Your Mac
Apple has a reputation for making things straightforward, and checking your Mac's processor specs is no exception. Everything you need is built right into macOS, whether you just need a quick peek at your hardware or want to get into the weeds of real-time performance.
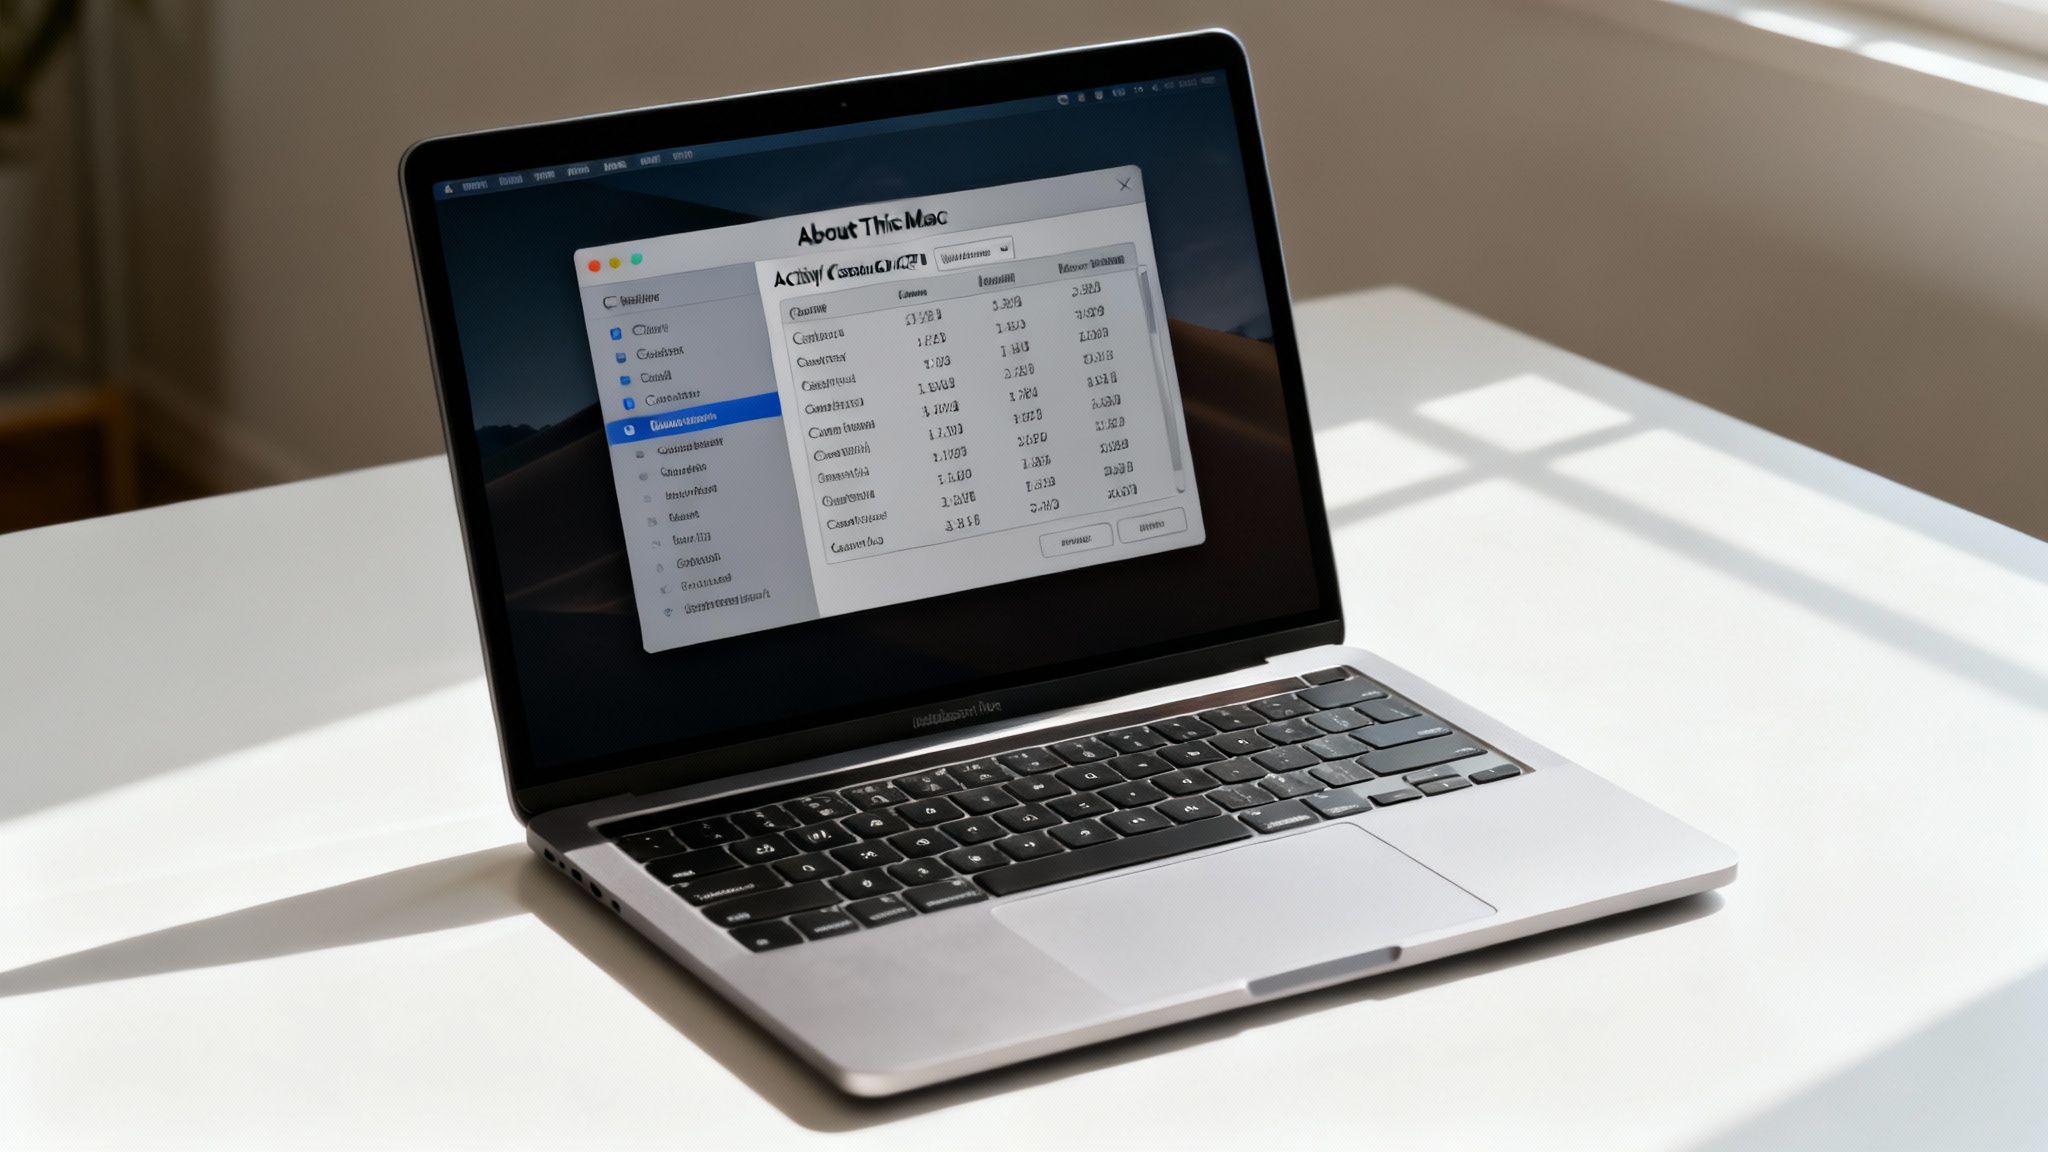
The quickest way to see what processor you're working with is through the "About This Mac" window. Just click the Apple logo in the top-left corner of your screen and choose About This Mac. A small window appears, and right under your Mac's model name, you'll see the exact "Processor" listed. This is my go-to when I need to confirm specs before installing new software or just satisfy my curiosity.
Diving into Activity Monitor
If you want to see what your CPU is doing right now, you need to open Activity Monitor. This is basically the Mac version of the Windows Task Manager, and it’s an incredibly powerful tool once you know your way around it.
You can find it tucked away in your Utilities folder. The easiest way to get there is:
- Open a new Finder window.
- Go to the Applications folder.
- Open the Utilities folder inside it.
- Double-click on Activity Monitor.
Once it's open, make sure you're on the CPU tab. This screen shows you a live list of every application and background process currently running, along with how much processing power each one is eating up. There’s also a handy little graph at the bottom that gives you a visual on your overall system load, what you’re using, and how much is idle.
Pro Tip: If your Mac suddenly feels like it's wading through molasses, pop open Activity Monitor and sort the list by the "% CPU" column. More often than not, you'll find a single culprit—like a rogue browser tab or a background sync—hogging all the resources.
Advanced Monitoring Tools
Activity Monitor is great, but it has to be open to be useful. For those of us who like to keep a constant eye on system performance, a third-party app is the way to go. Tools like iStat Menus are fantastic because they place a detailed CPU monitor right in your menu bar. You can get real-time stats on core usage and even temperature without having a window cluttering your screen.
The need for these kinds of insights has exploded. The IT monitoring tools market was valued at $26.05 billion back in 2022 and is expected to skyrocket to $96.85 billion by 2030. This massive growth is a big reason why built-in tools like Activity Monitor have become so capable, giving regular users the kind of diagnostic power that was once reserved for IT pros. For a deeper dive, check out this recent industry analysis.
Of course, keeping your Mac running smoothly is about more than just hardware. It also involves managing your accounts and settings correctly. If you're ever selling a Mac or troubleshooting a problem tied to a specific user, our guide on how to sign out of an Apple ID can be a real lifesaver.
Checking CPU Specs on Linux and Mobile Devices
It's not just about desktops and laptops anymore. Whether you're wrangling a Linux server or just curious about the powerhouse in your pocket, figuring out your CPU details is a universal need. The methods just change depending on the machine you're using.
Diving into the Linux Command Line
If you're on Linux, the terminal is your best friend for getting straight to the facts about your hardware. It's the most direct and powerful way to see what's under the hood, and you don't need to be a command-line wizard to do it.
For a quick and detailed snapshot of your processor, pop open the terminal and run the lscpu command. It gives you a clean, static breakdown of your CPU's architecture.
You'll get a ton of useful info, including:
- Architecture: Tells you if you're on a 32-bit (i686) or 64-bit (x86_64) system.
- Model name: The exact processor model, like "Intel Core i7-1185G7".
- CPU(s): The total count of logical processors (threads).
- Core(s) per socket: How many physical cores your CPU has.
But what if you need to see what your CPU is doing right now? For that, htop is my go-to. It’s a fantastic interactive tool that shows you real-time usage for every single core, along with memory usage and a list of the processes currently hogging your resources.
Finding Your Phone's Processor Information
Smartphones are a totally different beast. Both Android and iOS are locked-down ecosystems compared to a PC, but with the right app, you can still uncover the specs.
On Android, a couple of free apps have become the standard for this kind of hardware sleuthing. I personally rely on CPU-Z and AIDA64. Just install one from the Play Store, and you'll get a detailed report on your phone's System-on-a-Chip (SoC), covering everything from the core count and ARM architecture to the current clock speeds of each core.
Key Takeaway: Phone makers often use a wide range of custom chips. An app like CPU-Z is the easiest way to confirm if your device is powered by a Qualcomm Snapdragon, MediaTek Dimensity, or Samsung Exynos processor.
This whole idea of monitoring performance is becoming more mainstream. A recent study found that on-premises monitoring tools still accounted for over 60% of market revenue, but cloud-based solutions are quickly catching up. For us regular users, this trend is why we're seeing more pro-level features, like "performance modes" on laptops and "CPU boost" settings on gaming phones, trickle down from the enterprise world. You can read more about this growing market on Mordor Intelligence.
Apple keeps its hardware details under tight wraps on iOS. If you look in the Settings app, you'll only find a generic name like "A16 Bionic," with no real specifics. To dig deeper, you’ll have to head to the App Store. An app like Lirum Device Info Lite can often sniff out the more granular data about your iPhone's processor that Apple doesn't show you.
Before you start installing diagnostic tools on your phone, it’s always smart to make sure your data is safe. Take a look at our guide on how to backup your phone data to make sure you have a recent copy of everything important.
Turning CPU Data into Actionable Insights
You've successfully pulled up your CPU stats, and now you're staring at a bunch of graphs, numbers, and percentages. So, what does it all mean? Getting a handle on these metrics is the real trick to understanding your device's health and performance.
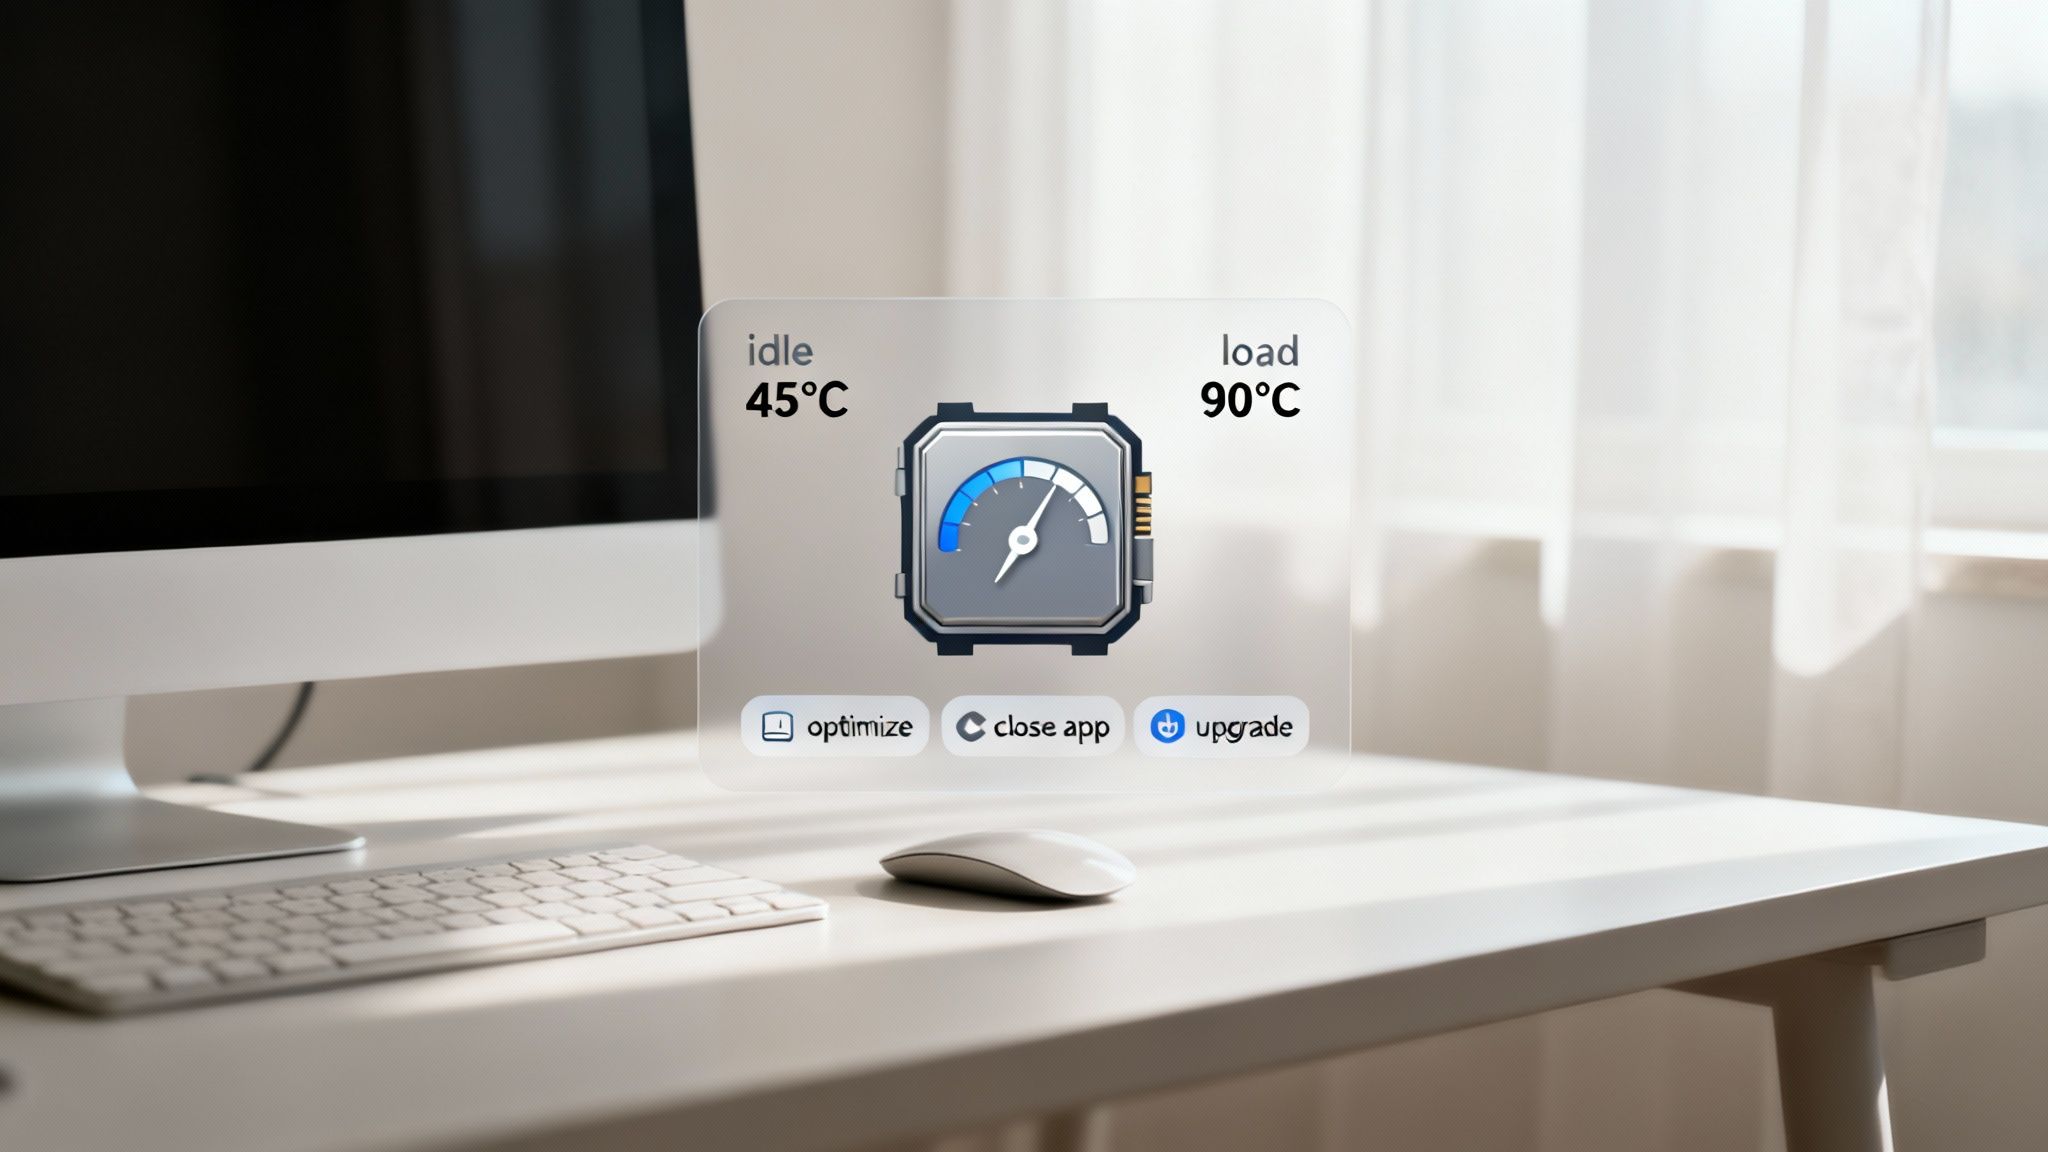
Let's start with CPU usage. Don't panic if you see a 100% CPU load. If you're doing something intensive like exporting a 4K video, running a massive data analysis, or compiling code, your processor is supposed to be maxed out. That just means it's firing on all cylinders to get the job done as fast as possible.
The real red flag is when your CPU usage is sky-high while your computer should be idle. If you grab a coffee and come back to find the CPU is still churning away at 70%, something’s up. This is usually caused by a "runaway process"—a glitchy app or a background service caught in a loop, wasting power and cooking your components for no good reason.
Identifying and Managing Problem Processes
When you spot that unexpected high usage, it's time to play detective. Head back to your system's monitor (Task Manager on Windows or Activity Monitor on macOS) and sort the process list by CPU percentage. The culprit will usually jump right to the top.
If it's an app you recognize, like a browser or a game, just try closing it normally. If you see a process name you don't know or it won't close, a quick web search will tell you if it's a critical system component or something you can safely terminate. Leaving these runaway processes unchecked will absolutely destroy your battery life. For those on laptops, we have a complete guide on how to extend laptop battery life that you'll find helpful.
Understanding CPU Temperatures
Heat is a natural side effect of a CPU doing its job, but too much of it is the enemy of performance and longevity. Consistently high temperatures can literally wear out your hardware over time.
As a general rule of thumb, here’s what you should be seeing:
- Idle: Anything below 50°C (122°F) is great.
- Under Load (Gaming/Work): A range of 70°C to 85°C (158°F - 185°F) is perfectly normal and safe.
- Danger Zone: If your CPU is constantly hitting 95°C (203°F) or more, it’s a sign to take action.
When a processor gets too hot, it protects itself with a feature called thermal throttling. The CPU deliberately slows down to cool off, which you'll feel as stuttering, lag, or just a general sluggishness in your system.
If you're getting throttled, it’s a clear signal that your cooling system needs attention. This could be as simple as cleaning out dusty fans and vents or reapplying thermal paste. A little bit of maintenance can bring your performance right back and keep your machine running strong for years.
Your Top CPU Questions, Answered
Once you’ve got a handle on checking your CPU stats, a whole new set of questions usually follows. What do all these numbers actually mean in the real world? Let's break down the most common ones so you can interpret the data and start troubleshooting with confidence.
What’s a Good CPU Temperature for Gaming vs. Idle?
I always tell people to think about CPU temps in two main scenarios: idle and under load.
When your computer is just humming along, maybe with a few browser tabs open, the sweet spot is anywhere between 30°C and 50°C (that's 86°F to 122°F). In this state, it should be running cool and quiet.
Now, fire up a demanding game or start rendering a video, and things are going to get toasty. It's perfectly normal to see temperatures jump up to the 70°C to 85°C (158°F to 185°F) range. Your cooling system is working as intended. The real red flag is when your CPU consistently pushes past 95°C (203°F). If you see that, it's time to take a serious look at your fans, thermal paste, and overall case airflow.
My CPU Usage Is Stuck at 100 Percent. What Should I Do?
Seeing your CPU usage pinned at 100% when you aren't doing anything intensive is a classic sign something’s wrong. The first thing you need to do is play detective with your system's activity monitor (Task Manager on Windows or Activity Monitor on macOS).
Once you have it open, sort the list of processes by the "% CPU" column. This will bring the culprit straight to the top.
- Is it an app you recognize? Try closing it normally. If it’s frozen, you might have to force quit.
- Don't recognize the process name? A quick search online for the name will usually tell you if it's a legitimate system process or something more suspicious.
- Still having issues? If you can't find the cause or it keeps happening, running a full malware scan is the next logical step. Some nasty programs run in the background, hogging resources.
A Quick Tip: A runaway process isn't just about sluggish performance. On a laptop, it absolutely torches your battery life and generates a ton of heat for no good reason.
How Do I Check My CPU Core and Thread Count?
Knowing your core and thread count is key to understanding how well your machine can multitask. Thankfully, finding this info is simple.
On a Windows machine, just pop open Task Manager (Ctrl + Shift + Esc), switch over to the 'Performance' tab, and click on 'CPU'. You'll see the number of Cores and Logical processors (your threads) listed right there.
If you're on a Mac, click the Apple menu in the corner, choose 'About This Mac,' and the processor information will show you the total core count. For Linux users, the terminal command lscpu gives you a beautifully detailed breakdown of your CPU's architecture, including cores and threads per core.
Are Third-Party CPU Monitoring Tools Safe to Use?
Absolutely, as long as you're smart about where you get them. Tools like CPU-Z, Core Temp, HWMonitor, and AIDA64 are trusted industry standards used by countless enthusiasts and IT pros. They’re safe, reliable, and provide far more detail than built-in utilities.
The golden rule is to always download these tools directly from the developer's official website. Steer clear of third-party download sites or mirrors. They have a nasty habit of bundling installers with adware or other junk you don’t want on your system. Going straight to the source guarantees you get the clean, official version every time.
At Simply Tech Today, we believe understanding your technology is the first step toward mastering it. For more guides and simple explanations on everything from gadgets to software, check out our latest articles.

Member discussion